Marketing No Comments

Factors that impact the UK property market in 2021

It is absolutely fair to assume that 2021 will have its fair share of uncertainty, especially concerning the property market in the UK. In 2020, when Covid-19 came into being, the housing market and the real estate market in the UK and all over the world were severely impacted. While we have seen many government schemes come into play to boost the real estate market and the economy as a whole, no expert can predict with any amount of certainty what the future of the UK property market holds. However, here are some important factors that will have an impact on the UK property market in 2021.

Stamp duty holiday

After the first lockdown, the government introduced the stamp duty holiday in July 2020 in the UK. The stamp duty holiday was a temporary suspension of the stamp duty that needs to be paid by the buyer when he or she purchases real estate. The government announced the stamp duty holiday to boost the buyer’s confidence, revive the real estate market and make housing slightly affordable. Due to its enormous success, the stamp duty holiday has now been extended till September 2021. Whether the government decides to further extend this temporary suspension on stamp duty and how the real estate market will react to the suspension or introduction of stamp duty will have a huge impact on the real estate market in the UK.

To find out more about how we can assist you with your Mortgage requirements, please click here to get in touch

Change in buyer demand

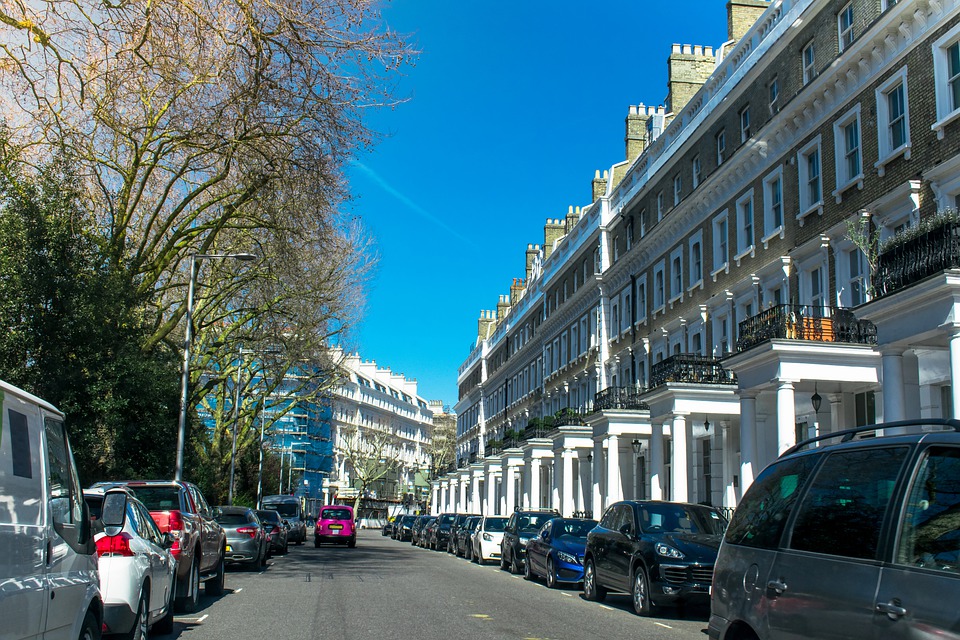
As more and more people have started working from home, there has been a significant shift in buyer demand and the priorities of the buyer. Earlier, potential buyers would look for properties in the city centre which are close to their place of work. Now, homeowners and potential buyers have started looking at properties in the outskirts and the boroughs. One reason is that homeowners and professionals are looking to shift into bigger places as they wish to improve their standard of living since they are not spending more time at home. Secondly, the average price of the property in the suburbs and boroughs is relatively cheaper than in the city centre, which allows homeowners and potential buyers to purchase spacious properties at affordable prices. Also, there has been an increase in demand for properties with spare bedrooms, maybe an outhouse or a garage space, to convert these spaces into work from home offices. This change in buyer demand will certainly play a big role in the future of the real estate market in 2021.

Low deposit mortgages

Earlier, it was very easy for first-time buyers and potential investors to get low deposit mortgages. However, due to the uncertainty of Covid-19 and the increase in unemployment, banks and lenders have drastically reduced the availability of low deposit mortgages, to a point where it barely exists in today’s lending market. However, the UK government has announced a mortgage guarantee scheme under which buyers and investors will be able to secure a mortgage by paying only 5 per cent of the deposit. Low deposit mortgages will have a great impact on the future of the real estate sector. If this scheme leads to an increase in the demand for housing and helps revive the property market, then it will be a game-changer for the real estate industry as well as for lenders and banks.

Read about the UK Housing Market via our Specialist Residential & Buy to Let Division

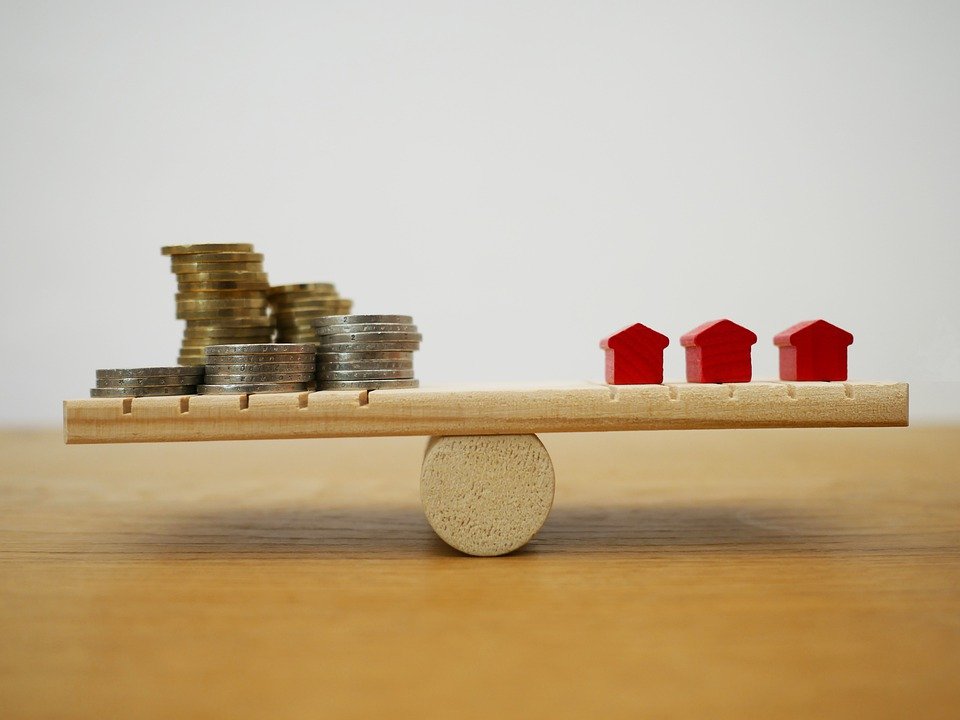
Change in the average price of property

What factors affect the price of property? First and foremost, the supply and demand of real estate and housing will play a big role in deciding the price of property in certain areas. Secondly, the availability of mortgages and the rate of interest will play a role in the number of properties that are actually sold. Due to the uncertainty around Covid-19, banks and lenders became very strict about their lending criteria, which took a toll on the housing market. And, the criteria started becoming stricter, the number of mortgages in the market started to fall, hence, there was a significant change in interest rates. Inflation and unemployment also play a big role in deciding the average price of property, as inflation rates and unemployment rates affect the economy as a whole. And of course, political uncertainty caused by Brexit also took a toll on the real estate sector. Therefore, multiple factors, such as the ones listed above, play a big role in determining the property’s average price, which will ultimately impact the UK real estate industry.

Source: News Anyway

Discover our Mortgage Broker services.

Marketing No Comments

The Best Areas in London for Buy-to-Let Yields This Year

Buy to Let – Since the onset of COVID-19, investors have turned away from many of the asset classes whose presumed security and capacity for long-term value creation were once thought unimpeachable. With international lockdowns accelerating existing trends towards flexible working practices and e-commerce, investors have seen billions wiped off the value of commercial property assets.

However, while commercial property has suffered, the value of residential assets has fared well during the pandemic. Thanks to the extended stamp duty holiday, the sales market is buoyant and price growth has exceeded expectations, while a surprisingly robust lettings market benefited from permission to continue operating during later lockdowns and a flurry of activity as renters seek out housing that more closely aligns with their post-COVID priorities.

At Home Made, we have analysed data from thousands of property listings across London to create an up-to-date guide on buy-to-let rental yields for investors in the capital. Here are the top 10 postcodes in London offering investors the best rental yields for 1, 2, and 3-bedroom properties.

To find out more about how we can assist you with your Mortgage requirements, please click here to get in touch

1-bedroom properties

  1. IG11 (Barking, Upney) – 6.12 per cent
  2. N9 (Lower Edmonton) – 5.89 per cent
  3. TW13 (Feltham, Twickenham) – 5.65 per cent
  4. EN8 (Cheshunt, Waltham Cross) – 5.57 per cent
  5. IG1 (Ilford) – 5.56 per cent
  6. EN3 (Enfield) – 5.50 per cent
  7. RM6 (Chadwell Heath, Goodmayes, Marks Gate, Little Heath) – 5.46 per cent
  8. RM1 (Romford) – 5.43 per cent
  9. RM7 (Romford, Dagenham, Hornchurch) – 5.39 per cent
  10. IG2 (Gants Hill, Newbury Park, Aldborough Hatch) – 5.35 per cent

2-bedroom properties

  1. UB1 (Southall) – 5.93 per cent
  2. IG11 (Barking, Upney) – 5.64 per cent
  3. EN3 (Enfield) – 5.52 per cent
  4. RM6 (Chadwell Heath, Goodmayes, Marks Gate, Little Heath) – 5.48 per cent
  5. N9 (Lower Edmonton) – 5.42 per cent
  6. TW5 (Hounslow) – 5.39 per cent
  7. N18 (Upper Edmonton) – 5.39 per cent
  8. IG1 (Ilford) – 5.37 per cent
  9. IG3 (Ilford, Cransbrook, Loxford) – 5.35 per cent
  10. RM1 (Romford) – 5.33 per cent

3-bedroom properties

  1. RM8 (Dagenham, Beacontree) – 5.13 per cent
  2. RM9 (Dagenham, Beacontree) – 5.01 per cent
  3. RM10 (Dagenham, Beacontree) – 4.90 per cent
  4. IG11 (Barking, Upney) – 4.80 per cent
  5. EN3 (Enfield) – 4.76 per cent
  6. RM3 (Harold Wood, Harold Hill) – 4.64 per cent
  7. N9 (Lower Edmonton) – 4.61 per cent
  8. CR0 (Croydon) – 4.56 per cent
  9. N18 (Upper Edmonton) – 4.54 per cent
  10. CR7 (Thornton Heath) – 4.54 per cent

Overall

  1. IG11 (Barking, Upney) – 5.13 per cent
  2. RM10 (Dagenham, Becontree) – 4.97 per cent
  3. RM9 (Dagenham, Becontree, Castle Green) – 4.94 per cent
  4. RM8 (Dagenham, Becontree, Becontree Heath, Chadwell Heath) – 4.91 per cent
  5. SE28 (Thamesmead, Greenwich, Bexley) – 4.88 per cent
  6. E13 (Plaistow, West Ham) – 4.59 per cent
  7. RM3 (Harold Wood, Harold Hill, Noak Hill, Harold Park) – 4.54 per cent
  8. N9 (Lower Edmonton) – 4.44 per cent
  9. E6 (East Ham, Beckton, Barking) – 4.40 per cent
  10. RM6 (Chadwell Heath, Marks Gate, Little Heath, Goodmayes) – 4.35 per cent

Discover our Buy to Let Mortgage Broker services.

What does the data show and why?

As the data indicates, the most attractive investment prospects right now are mainly clustered in London’s outermost Eastern boroughs: Barking and Dagenham, Redbridge, and Havering. A review of our previous yields analysis (published in late 2019) suggests that there has been a sustained eastwards shift in the location of postcodes offering the best potential ROI for buy-to-let landlords.

There are several likely reasons why this is the case, with trends established both before and during the pandemic responsible for the continuing eastwards shift.

Improvements to transport infrastructure

As was the case in our original 2019 analysis, improvements to London’s transport infrastructure mean that residents in high-yield areas can commute into the major economic hubs of the city centre with relative ease. The forthcoming Elizabeth line will drastically improve transport connections between many of this year’s best performing locations to the rest of the TfL network, with stations opening in Ilford, Goodmayes, Chadwell Heath, and Romford. We know that rental prices react more quickly than sales values to infrastructural improvements, so investors should expect to see an even greater spike in rental yield value in these East London suburbs.

The impact of urban redevelopment

Urban redevelopment schemes that introduce thousands of units of high-specification housing and modern amenities tend to change the profile of tenants, making them more attractive to working professionals on higher incomes. This increases the value of nearby property, leading to a sustained rise in rental yields over the medium term as rental price growth outpaces the growth in sales prices.

East London’s outer boroughs are currently further behind in their redevelopment journey than many of the more central neighbourhoods that have already been transformed by various urban renewal projects (e.g Stratford, Royal Docks). Ambitious redevelopment plans underway in the East, particularly in Havering, are set to have a similar impact, and investors should expect to see consistent growth in rental yields along with significant appreciation in the sales value of any property.

Consumer and renter behaviour

Tenant migration patterns have been altered significantly by COVID-19. Since the onset of the pandemic, the widespread adoption of flexible working practices has meant that renters have had more freedom to move across the city without as much concern for the impact on their daily commute. When we analysed enquiry data for rental properties in TfL travel zones 4, 5, and 6, we found that 40 per cent of the renters enquiring on properties in these areas were currently based in zones 1, 2, and 3, suggesting a significant spike in the number of tenants moving towards London’s suburbs. Similarly, 64 per cent of the renters logged in our database in 2020 were moving to a completely new area of the city, with an average travel time of 44 minutes between their previous property and prospective new home.

As well as having the flexibility to stray further away from the workplace, tenant priorities have changed drastically following our collective experiences of successive lockdowns. The so-called ‘race for space’ is well documented, with many tenants moving to the suburbs or leaving the city altogether in search of larger properties with more access to green space and better suited to pet ownership – features which are now a higher priority for many than proximity to the workplace.

Many have also moved further away from the centre to reduce costs during a period of sustained economic upheaval. For many of London’s working professionals, it no longer makes financial sense to pay a premium for expensive central property when there is no need to maintain a daily physical presence in the workplace. Properties in high-yield areas are able to satisfy both the post-COVID lifestyle priorities and affordability criteria of London’s renters.

Overall, the residential lettings market has proven remarkably adaptable when faced with unprecedented economic and social circumstances, along with various existing trends that disrupt the way people rent and let property. As a result, buy to let rental yields in outer zones have remained high, and even increased in the last 18 months, as renters expanded their search radius to include the new areas that they would now consider living in.

BY PETE CARVILL

Source: Property Wire

Discover our Mortgage Broker services.

Marketing No Comments

Buyers are making offers on homes before viewing

A growing number of property buyers are making offers on homes before viewing them in order to gain a competitive edge in what has been described as a ‘mad’ housing market.

BBC Wales Live reports that many estate agents in the Wales are selling properties within hours of listing them, sometimes with dozens of offers on the table. This is a trend also identified in some other UK hotspots.

The surge in demand for property has left some buyers looking for new ways to gain an advantage over other purchasers.

To find out more about how we can assist you with your Mortgage requirements, please click here to get in touch

Last month demand for some properties in Aberdare saw people queueing overnight outside an estate agents.

Mel John, an estate agent in Caerphilly, said that there has been a sharp rise in practices like gazumping in recent weeks.

“I’ve walked away from a number of properties where the sellers would have encouraged gazumping, as an estate agent I wouldn’t want to be any part of that,” she told the BBC. “I don’t think it’s ethical really for anybody to go down that route.”

Purchases across the UK are paying over the asking price for properties, as the current supply-demand imbalance results in competitive bidding wars.

More than a third of property sales were subject to multiple offers during the first quarter of 2021, according to research by Hamptons.

Read about the UK Housing Market via our Specialist Residential & Buy to Let Division

Some 36% of homes sold by the company in Q1 2021 received offers from at least three buyers.

Separate data released by Propertymark this week revealed that one in three properties sold for more than the asking price in April.

The 32% of properties sold for more than the original asking price in April is twice as many properties than in March when 16% of homes sold for over the initial asking price.

Mark Hayward, chief policy advisor, Propertymark, said: “It is phenomenal to see demand for housing breaking records, as house buyers continue to fuel the post Covid economy. However, the continued imbalance of supply and demand is a concern and has led to a strong sellers’ market with properties being snapped up quickly at high prices.”

By MARC DA SILVA

Source: Property Industry Eye

Discover our Mortgage Broker services.

Marketing No Comments

Value of UK house sales to jump 46 per cent this year but London lags behind

The total value of UK house sales is set to reach £461bn this year, a 46 per cent jump on 2020, according to new data.

Property website Zoopla predicts that the current housing market boom is likely to surge to its busiest rate for 14 years.

The forecast comes after data last week showed that UK house prices rose by 10.2 per cent in March, its highest growth rate since August 2007, before the financial crisis hit.

The unprecedented growth has been fuelled by an extension to the stamp duty holiday and new government guarantees for mortgages.

Zoopla said that it expects house sales to reach 1.52m this year, which would put 2021 in the top 10 busiest years since 1959.

To find out more about how we can assist you with your Mortgage requirements, please click here to get in touch

London lags behind

Demand for family homes is diverting buyer interest away from London, with interest in properties in Wales and Yorkshire surging.

London continues to trail when it comes to house price growth at 1.9 per cent, the slowest regional rate across the UK for the sixth consecutive month.

Homes are taking just under two months to sell in inner London, two weeks longer than the 2017 to 2019 average.

Four central London boroughs are registering price falls for a third month in a row, including the City, Westminster, Kensington & Chelsea, and Hammersmith & Fulham.

These areas have been particularly affected by the shutdown of business due to the pandemic.

Read about the UK Housing Market via our Specialist Residential & Buy to Let Division

The capital ‘will recover’

Despite London’s declining dominance in the housing market, analysts believe the UK’s city centres will recover and thrive as workers return.

“The pandemic has pushed London to the bottom of the house price inflation league, but as we face into what seems to be a solid recovery, there can be little doubt that it will soon be gaining places and rising up the table,” said John Eastgate, managing director at Shawbrook Bank.

“With solid fundamentals underpinning the property market even after the end of the stamp duty holiday, there’s a strong argument to suggest that our cities, London in particular, represent good value today for both homeowners and investors.”

By Damian Shepherd

Source: City AM

Discover our Mortgage Broker services.

Marketing No Comments

Landlords invest £839m a year upgrading new rental property

Landlords spend an estimated £839m each year upgrading newly purchased rental property before letting it out to tenants, research from Paragon Bank has revealed.

A survey of approximately 900 landlords showed that nearly four in five (77%) invest in upgrading property after purchase, spending an average of £8,720 each.

Based on the average number of buy-to-let mortgages granted each year since 2015, this spend would equate to a £839m annual investment in upgrading private rental stock.

The most common work undertaken is general painting and maintenance (67%), electric or plumbing work (44%), and laying new flooring (37%). A third of landlords (32%) install a new kitchen or bathroom, with nearly a quarter (24%) installing a new boiler or upgrading windows (23%).

Richard Rowntree said: “Landlords typically will make significant improvements to a property before letting to tenants, helping to improve standards across the private rented sector.

To find out more about how we can assist you with your Mortgage requirements, please click here to get in touch

“Landlords will of course benefit from this investment through capital appreciation, but it always results in better quality homes for tenants.

“There is a clear correlation between buy-to-let investment and improving standards in the quality of private rental homes. Standards of property in the PRS have increased significantly over that period.

“Overall homes in the sector are newer, larger, warmer and more energy efficient than they were 10 years ago and tenants have more choice.

“Whilst we recognise more needs to be done to improve standards, since 2009 there are nearly three times the number of properties with an energy rating of C or above, a 100% increase in the number of homes built after 1990 and a substantial expansion in the types of property available to rent in the PRS.”

Discover our Buy to Let Mortgage Broker services.

Paragon’s new report, Driving Standards in the Private Rented Sector, highlights how the standard of property in the sector has improved over the past 10 to 15 years.

Since 2006, the portion of homes in the sector classed as ‘decent’ under government standards has increased from 53.2% to 76.7%. Overall, 3.6 million homes are now classed as decent, compared to 1.4 million in 2006.

Over that same period, 1.4 million buy-to-let mortgages for house purchase have been approved.

Conversely, the number of homes classed as non-decent in the PRS has not reduced significantly, with 1 million homes categorised as non-decent today compared to 1.21 million in 2006. This suggests that the growth in new properties coming into the PRS over that period is driving up standards for the sector overall and diluting the stubborn proportion that remains non-decent.

Source: Mortgage Introducer

Discover our Mortgage Broker services.

Marketing No Comments

Housing market set to be busiest since 2007, Zoopla says

This year’s housing market is on course to be the busiest since 2007, according to a property website.

Around 1.52 million UK house sales are expected across 2021, up by 45% compared with last year, Zoopla said.

The value of homes sold in 2021 is projected to reach £461 billion, up by 46% or £145 billion.

The website said that, with average annual transactions rarely exceeding one million to 1.2 million per year over the past decade, this would mark the highest sales figures since 2007.

The stamp duty holiday in England and Northern Ireland and its subsequent extension has provided an added impetus for many people to purchase a home, its report said.

To find out more about how we can assist you with your Mortgage requirements, please click here to get in touch

Households who have the opportunity to commute less frequently have more options when it comes to choosing where to live, and this could prompt a move

Grainne Gilmore, Zoopla

It said the hottest sales markets currently include Wales, Yorkshire and the Humber and the North West of England – particularly Liverpool, Manchester, Wigan and Burnley.

Some areas are bucking the trend, with properties in inner London taking nearly two weeks longer to go under offer typically compared with 2020.

Homes in Southampton, Gloucester, Edinburgh and Coventry are also spending longer on the market, although price growth remains positive across these cities, Zoopla said.

Read about the UK Housing Market via our Specialist Residential & Buy to Let Division

The website said that overall, 2021 is projected to be among the 10 busiest years since 1959.

Grainne Gilmore, head of research at Zoopla, said: “Households who have the opportunity to commute less frequently have more options when it comes to choosing where to live, and this could prompt a move.

“Likewise, older households will continue to review how and where they are living, with many more set to move for the first time in years. With an increased array of mortgages to choose from, first-time buyers will also remain active in the market.

“At the same time, supply constraints will continue to underpin pricing. The lack of supply is expected to hamper potential sales during this year, yet even so, we expect total transactions this year to rise to 1.5 million, marking one of the busiest years in the UK’s residential market in more than a decade.”

Source: Express & Star

Discover our Mortgage Broker services.

Marketing No Comments

House prices to continue upward trend this year, Nationwide predicts

Nationwide Building Society, the UK’s second-largest mortgage lender, has predicted that house prices will continue to rise this year beyond the end of the stamp duty holiday.

The lender has warned, however, that higher costs could make it harder for first-time buyers to get on the property ladder.

The society’s chief executive, Joe Garner, said everyone had been a “little bit surprised” by how strong the housing market had been throughout the Covid crisis, even when taking government support, including business loans and wage subsidies, into consideration.

To find out more about how we can assist you with your Mortgage requirements, please click here to get in touch

Figures published by the Office for National Statistics last week showed house prices rose 10.2 per cent in the year to March, the highest annual increase since the lead-up to the financial crisis in August 2007.

Mr Garner said demand had been underpinned by a “structural shift” in the kind of homes that buyers were looking for in the wake of the Covid-19 pandemic, which has caused a home-working boom, and fuelled interest in larger homes with gardens outside city centres.

Mr Garner said: “People don’t say: ‘Oh look, there’s a discount on stamp duty, let’s move home.’ That’s not how it works. People are thinking of their house less as an investment and more as a home.”

Read about the UK Housing Market via our Specialist Residential & Buy to Let Division

A Nationwide survey of homeowners last month found that 25 per cent were either considering, or in the process of, buying a house as a result of the pandemic, compared with 28 per cent in September. Usually, only about five per cent of homes switch hands in the UK, meaning that only a small portion of those homeowners need to act in order to keep the housing market moving.

Mr Garner continued: “There will be periods when it goes down a bit, but particularly as people are buying much more for their long-term home, it doesn’t matter so much the day-to-day value of the property if it’s somewhere they really want to live.”

Source: Scottish Legal

Discover our Mortgage Broker services.

Marketing No Comments

Falling buy-to-let rates make property a ‘tempting’ investment

Interest rates for buy-to-let mortgages are beginning to decrease, according to the latest data from Moneyfacts.co.uk.

Its figures revealed, since the start of May, the average buy-to-let two and five-year fixed rates for all loan-to-values (LTV) have fallen by 0.04% and 0.05% respectively.

What’s more, since March 2021 they have tumbled by 0.10% and 0.11%. At 2.95% and 3.30%, both rates are now the lowest they have been since January 2021 when rates were at 2.89% and 3.27% respectively.

According to Moneyfacts the largest reductions since the start of this month have been seen at 65% LTV.

In this tier the two and five-year fixed averages have dropped by 0.20% and 0.15% respectively to 2.68% and 3.17%, since the start of the month.

To find out more about how we can assist you with your Mortgage requirements, please click here to get in touch

This, said Moneyfacts, was great news for landlords with the required level of deposit or equity.

However, for those landlords with lower levels of deposit or equity the news is not so welcoming as the average two-year fixed rate at 80% LTV has slightly increased over the course of this month to sit at 4.20%.

There are more options available to borrowers in this tier, though, where rates are traditionally higher due to the higher level of risk, have also risen.

And those happy to lock into a five-year fixed rate at 80% LTV will benefit from average rate drops of 0.04% since the start of the month.

Eleanor Williams, finance expert at Moneyfacts.co.uk, said: “As lockdown restrictions begin to ease, the prevailing sentiment in the UK seems to be that of optimism.

“For a sector that has been beset by various changes and challenges over the last five years or so, the buy-to-let market is exhibiting remarkable resilience.

“While it goes without saying that the last year has presented great challenges to many investors in the sector, the latest Lettings Index from Hamptons illustrated that rents have risen by 5.9% in Great Britain in April 2021, the fastest rate of growth it has recorded since January 2015.”

Discover our Buy to Let Mortgage Broker services.

Williams added that the rate drops demonstrated an appetite from lenders to cater to borrowers who are keen to invest.

She revealed, as providers continued to tweak their ranges, Moneyfacts had seen rate reductions of as much as 0.90% from TSB, while Virgin Money made cuts of up to 1.06% on a selection of its products this month.

“Hampton’s indicated that the rise in rental growth may well be linked to the fact that there were 45% fewer homes available for rent in April 2021 compared to April 2019,” Williams added.

“For investors contemplating an expansion into the buy-to-let sector, demand from tenants is booming and while it remains difficult to earn a decent return on many forms of investment, it’s understandable why rental property could be a tempting option.”

Source: Mortgage Finance Gazette

Discover our Mortgage Broker services.

Marketing No Comments

The Kent towns where sold prices spiked the highest during lockdown

House prices have seen record rises between March 2020 and 2021, according to new data from the Office for National Statistics.

In spite of worries about the economy and the housing market since the onset of the global pandemic, property prices in Kent and the UK more broadly have remained strong.

Overall, our county has seen substantial rises, whilst the picturesque Tunbridge Wells has seen prices rocket by the most locally in the past year.

In March 2020, the average house price in Tunbridge Wells was £377,298, but by March 2021, it had jumped by 10.5 per cent – or £39,768 – to £417,066.

In other parts of Kent, prices were also up.

In Folkestone and Hythe, average prices rose by 12.9 per cent, or £33,491, to £293,076 at the end of March.

To find out more about how we can assist you with your Mortgage requirements, please click here to get in touch

Meanwhile there was a 13.7 per cent rise in Thanet, an increase of £32,004 to £265,517.

Canterbury and Dover also saw large proportional spikes, rising by 10.7 per cent and 11.5 per cent respectively.

Compared to the rate of real wage growth, calculated by subtracting the rate of inflation from wage increases, this is even more significant – as during the pandemic, wages rose by just 2.8 per cent on average.

Across Kent as a whole, prices have risen by 8.8 per cent – or £25,647 – in the past year to an average of £317,251.

This means that house prices in Kent are now more than 10 times the average yearly income in the UK, which currently stands at around £31,000 a year.

This is slightly lower than the UK on average, clocking in at an increase of 10.2 per cent across the same period according to figures from the ONS.

This is the highest annual growth rate the UK has seen since August 2007, before the infamous ‘credit crunch’ financial crisis.

Early 2020 saw the housing market grind to a halt – as the first lockdown starting in late March closed estate agents and banned viewings.

Once things reopened, the UK’s average house price growth accelerated rapidly.

Th ONS said the pandemic may have caused house buyers to reassess their housing preferences.

The average price of detached properties increased by 11.7 per cent in the year to March 2021, in comparison flats and maisonettes rose by 5.0 per cent over the same period.

Here is the detailed breakdown of house prices across Kent.

Read about the UK Housing Market via our Specialist Residential & Buy to Let Division

Change in house prices from March 2020 to March 2021

From left to right, the statistics are as follows: District, average house price in March 2020, average in March 2021, price growth in £, price growth in percentages

Tunbridge Wells // £377,298 // £417,066 // £39,768 // 10.5%

Folkestone and Hythe // £259,585 // £293,076 // £33,491 // 12.9%

Thanet // £233,513 // £265,517 // £32,004 // 13.7%

Canterbury // £296,522 // £328,203 // £31,681 // 10.7%

Dover // £247,252 // £275,797 // £28,545 // 11.5%

Dartford // £296,658 // £324,905 // £28,247 // 9.5%

Kent // £291,604 // £317,251 // £25,647 // 8.8%

Sevenoaks // £438,933 // £463,573 // £24,640 // 5.6%

Tonbridge and Malling // £366,893 // £390,617 // £23,724 // 6.5%

Maidstone // £285,672 // £307,072 // £21,400 // 7.5%

Medway // £239,359 // £258,787 // £19,428 // 8.1%

Ashford // £295,451 // £312,957 // £17,506 // 5.9%

Swale // £240,915 // £256,208 // £15,293 // 6.3%

Gravesham // £280,197 // £290,077 // £9,880 // 3.5%

By Claire Miller and Harry Higginson

Source: Kent Live

Discover our Mortgage Broker services.

Marketing No Comments

HMRC: April resi transactions highest for that month since 2007

HMRC’s provisional non-seasonally adjusted estimate for UK residential transactions in April 2021 was 111,260, the highest total in April since 2007, when transactions were 126,450.
However, this is a drop from the March 2021 figure of 190,980.

Provisional non-seasonally adjusted UK residential transactions in April 2021 increased 197.8% year-on-year, but a substantial amount of this difference is due to the impacts of the COVID-19 pandemic on the April 2020 statistics.

In addition, the non-seasonally adjusted estimate of 392,170 for UK residential transactions during quarter one of 2021 was the highest Q1 total since the introduction of stamp duty statistics in their current format in 2005, and the highest quarterly total since Q2 2006 (419,270).

Due to the pandemic, quarter two of 2020 was the lowest quarterly total for UK residential transactions since Q1 2009.

Provisional estimates of UK residential transactions in April 2021 have shown an impact from the temporarily increased nil rate bands for stamp duty and and Land Transaction Tax (LTT).

To find out more about how we can assist you with your Mortgage requirements, please click here to get in touch

Following year-on-year decreases in April and May 2020 of around 50%, caused by the pandemic, non-seasonally adjusted UK residential transactions have gradually increased, peaking in March 2021 with a provisional estimate of 173,410.

For non-residential transactions, non-seasonally figures in April 2021 increased 94.4% year-on-year, but again this will largely be due to the effects of the pandemic on last year’s data.

Provisional estimates of UK non-residential transactions in April 2021, 10,520 non-seasonally adjusted and 10,160 seasonally adjusted, are similar to levels reported during April in recent years, excluding 2020.

Following yearly decreases in April and May 2020 of around 45% caused by economic effects around the pandemic, non-residential transactions have followed a generally increasing trend during subsequent months.

Joshua Elash said: “Transactions are significantly down from March due to a large number of purchases completing that month in anticipation of the stamp duty holiday expiring.

“It evidences how significant an impact the scheme is having on buyer appetite and confidence.

“April was always going to be softer in terms of number of transactions.

“The annual rebound has, however, been stunning.

“A year ago, the first lockdown bit into the property market hard, and this comeback is nothing short of astonishing.

“All in all, the data continues to support a growing argument that stamp duty should be abolished completely so as to continue to encourage transactions, upward mobility, and to support the economy.”

Mark Harris said: “April’s dip in transactions compared with March is likely to be at least partly due to the anticipated end of the stamp duty holiday, before its extension was announced, which resulted in buyers taking their foot off the gas to get deals done.

“Now that the holiday has been extended, activity has picked up again.

Discover our Residential Mortgage Broker services.

“Compared with April last year, when the housing market was closed to business thanks to the pandemic, there has been a massive 179.5% jump in transactions.

“That reflects the grinding to a halt of the market, as well as the surge in demand created by COVID, with more people bringing forward moves to the country and a growing desire for more space, both inside and out.

“On the lending front, lenders have plenty of cash and are keen to lend.

“There are some very competitive products, and with Nationwide returning to 95% LTV mortgages at lower rates than its competitors, it is a good time to borrow.”

Jeremy Leaf, north London estate agent and a former RICS residential chairman, says: “Although these figures reflect many sales agreed several months ago, they show a reduction in activity as many buyers did not expect to still take advantage of the stamp duty holiday.

“However, activity has picked up strongly since the deadline was extended, allowing many to continue where they left off, as well as encourage new entrants to the market.

“Transactions are always a better measure of housing market strength than prices which tend to fluctuate.

“On the ground, supply is still a problem even though listings have improved as rollout of the second jab in particular is encouraging sellers to make their properties available.

“It is not only some sellers who are trying to profit from the home buying frenzy but certain solicitors are charging exorbitant fees to take on work, whereas others are working evenings and weekends to make sure they get over the line in time.”

By Jessica Bird

Source: Mortgage Introducer

Discover our Mortgage Broker services.